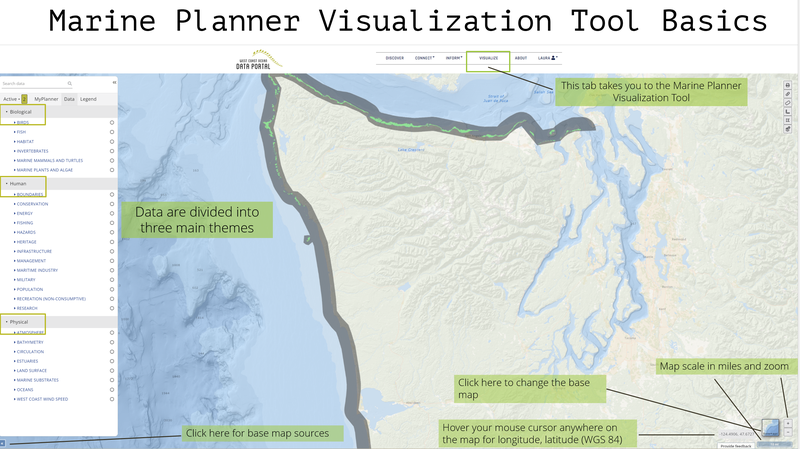
West Coast Ocean Data Portal's Marine Planner Visualization Tool Basics
The West Coast Ocean Data Portal is regional resource that connects data, people, and technical capacity across the West Coast
The Visualization Tool is made up of over 100 spatial layers from a variety of contributors. These spatial layers are usually stored online by data contributors as a Web Feature Service or Web Map Service.
No data is hosted by the West Coast Ocean Data Portal, when web services are updated the changes are automatically reflected in the Visualization Tool.
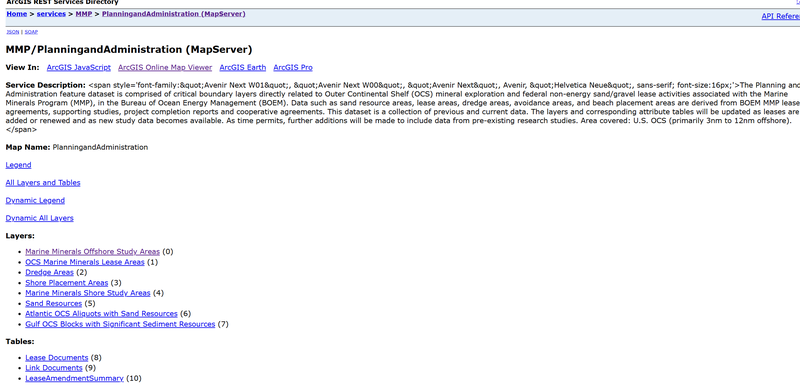
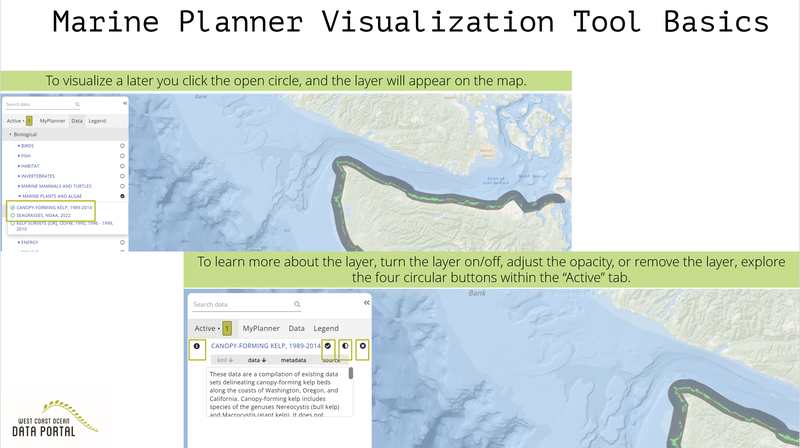
The West Coast Ocean Data Portal's Visualization Tool is an interactive in-browser instance of GIS with curated layers based on West Coast ocean issues
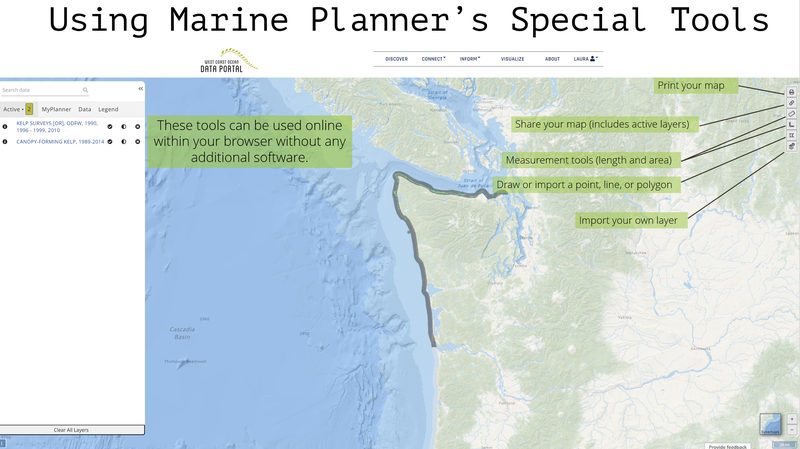
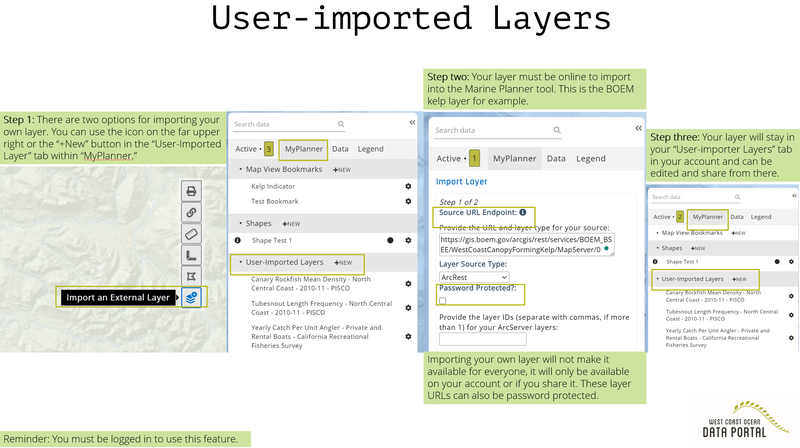
The Visualization Tool has Special Tools that can be used to facilitate real-time collaboration